You can not select more than 25 topics
Topics must start with a letter or number, can include dashes ('-') and can be up to 35 characters long.
3.3 KiB
3.3 KiB
lws detailed latency
Introduction
lws has the capability to make detailed latency measurements and report them in realtime to a specified callback.
A default callback is provided that renders the data as text in space-separated format suitable for gnuplot, to a specified file.
Configuring
Enable LWS_WITH_DETAILED_LATENCY at cmake.
Create your context with something similar to this
#if defined(LWS_WITH_DETAILED_LATENCY)
	info.detailed_latency_cb = lws_det_lat_plot_cb;
	info.detailed_latency_filepath = "/tmp/lws-latency-results";
#endif
lws_det_lat_plot_cb is provided by lws as a convenience to convert
the stuct data provided at the callback interface to space-separated
text data that is easy to process with shell commands and gnuplot.
lws_det_lat_plot_cb format
728239173547 N 23062 0 0 23062 0 0 0
728239192554 C 18879 0 0 18879 0 0 0
728239217894 T 25309 0 0 25309 0 0 0
728239234998 r 0 0 0 0 271 172 256
728239250611 r 0 0 0 0 69 934 4096
728239255679 w 19 122 18 159 20 80 80
728239275718 w 20 117 15 152 18 80 80
728239295578 w 10 73 7 90 7 80 80
728239315567 w 9 67 5 81 7 80 80
728239335745 w 23 133 9 165 14 80 80
...
Each event is shown in 9 columns
- unix time in us
- event type
- N = Name resolution
- C = TCP Connection
- T = TLS negotiation server
- t = TLS negotiation client
- r = Read
- w = Write
- us duration, for w time client spent waiting to write
- us duration, for w time data spent in transit to proxy
- us duration, for w time proxy waited to send data
- as a convenience, sum of last 3 columns above
- us duration, time spent in callback
- last 2 are actual / requested size in bytes
Processing captured data with ministat
Eg, to summarize overall latencies on all captured writes
 $ cat /tmp/lws-latency-results | grep " w " | cut -d' ' -f6 | ministat
...
    N           Min           Max        Median           Avg        Stddev
x 1000            43           273           141       132.672     32.471693
Processing captured data with gnuplot
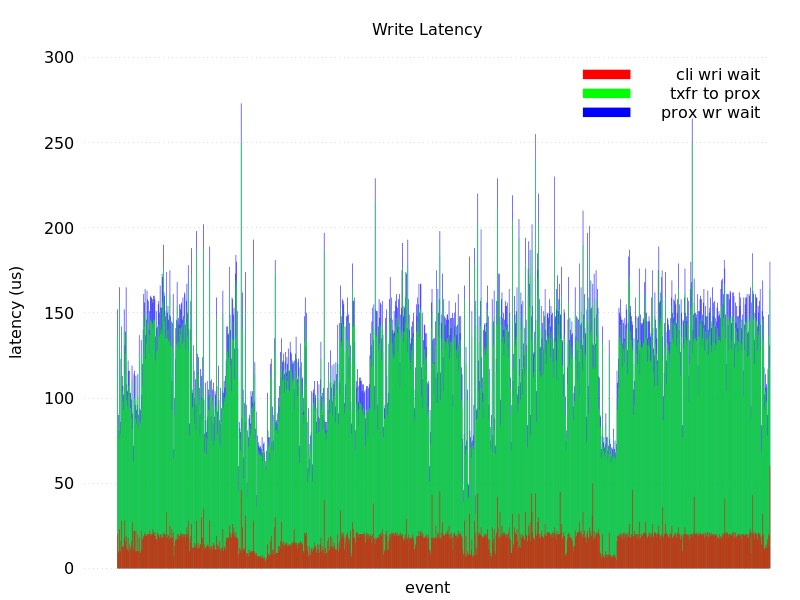
Gnuplot plotting script
Create a gnuplot script, eg myscript.gp
reset
set term pngcairo enhanced nocrop font "OpenSans, 12" size 800,600#output terminal and file
set output "lws-latency.png"
#set yrange [0:10000]
#to put an empty boundary around the
#data inside an autoscaled graph.
set offset graph 0.05,0.05,0.05,0.0
set style fill transparent solid 0.5 #fillstyle
set tics out nomirror
set xlabel "event"
set ylabel "latency (us)"
set format x ""
set title "Write latency"
set key invert reverse Right inside nobox
set key autotitle columnheader
set style data histogram
set style histogram rowstacked
set style fill solid border -1
set boxwidth 0.75
set style fill solid 1.00 noborder
set tic scale 0
set grid ytics lc rgb "#505050"
unset border
unset xtics

plot '/tmp/1' \
	   using ($3 + $4 + $5):xtic(1)         w boxes lt rgbcolor "blue"  title 'prox wr wait', \
	'' using ($3 + $4):xtic(1)         w boxes lt rgbcolor "green" title 'txfr to prox', \
	'' using 3:xtic(1) w boxes lt rgbcolor "red"   title 'cli wri wait'
gnuplot invocation
$ cat /tmp/lws-latency-results | grep " w " \>/tmp/1 ; gnuplot myscript.gp && eog lws-latency.png
