|
|
4 months ago | |
|---|---|---|
| .. | ||
| CMakeLists.txt | 4 months ago | |
| README.md | 4 months ago | |
| example.cc | 4 months ago | |
| example.png | 4 months ago | |
| example_console.cc | 4 months ago | |
| example_custom_data_source.cc | 4 months ago | |
| example_system_wide.cc | 4 months ago | |
| example_system_wide.png | 4 months ago | |
| system_wide_trace_cfg.pbtxt | 4 months ago | |
| trace_categories.cc | 4 months ago | |
| trace_categories.h | 4 months ago | |
README.md
Perfetto SDK example project
This directory contains an example project using the Perfetto SDK. It demonstrates how to instrument your application with track events to give more context in developing, debugging and performance analysis.
Dependencies:
- CMake
- C++11
Building
First, check out the latest Perfetto release:
git clone https://android.googlesource.com/platform/external/perfetto -b v14.0
Then, build using CMake:
cd perfetto/examples/sdk
cmake -B build
cmake --build build
Track event example
The basic example shows how to instrument an app with track events. Run it with:
build/example
The program will create a trace file in example.perfetto-trace, which can be
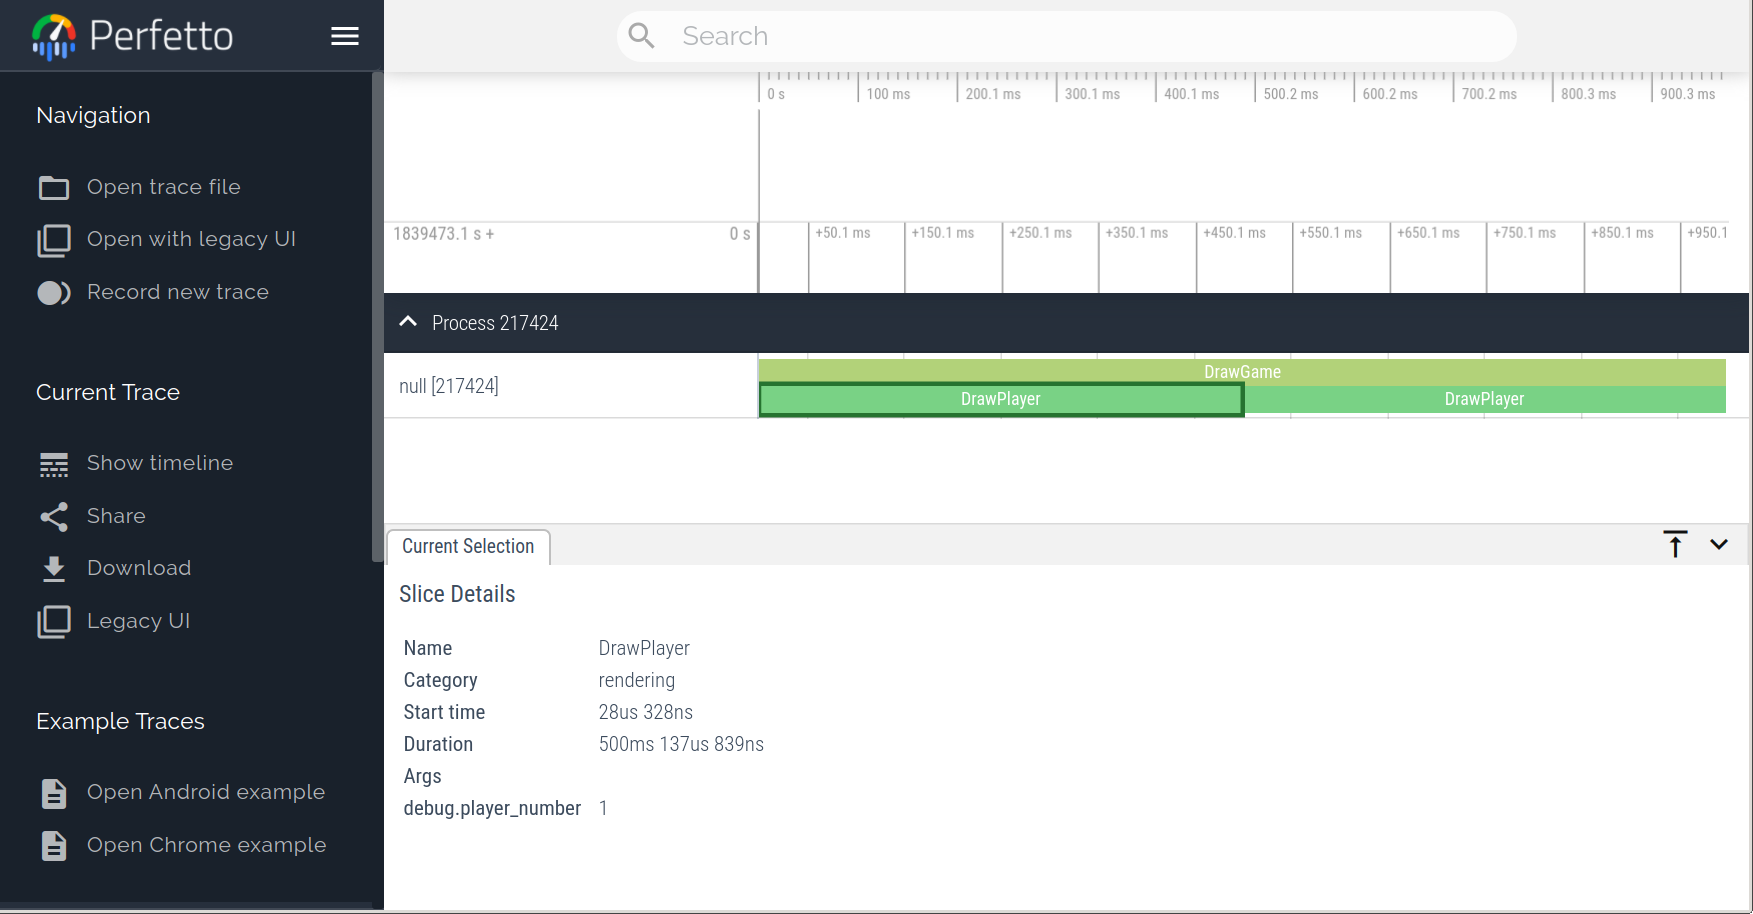
directly opened in the Perfetto UI. The result
should look like this:
System-wide example
While the above example only records events from the program itself, with Perfetto it's also possible to combine app trace events with system-wide profiling data (e.g., ftrace on Linux). The repository has a second example which demonstrates this on Android.
Requirements:
- Android NDK
- A device running Android Pie or newer
Tip: It's also possible to sideload Perfetto on pre-Pie Android devices. See the build instructions.
To build:
export NDK=/path/to/ndk
cmake -DCMAKE_TOOLCHAIN_FILE=$NDK/build/cmake/android.toolchain.cmake \
      -B build_android
cmake --build build_android
Next, plug in an Android device into a USB port, download the example and run
it while simultaneously recording a trace using the perfetto command line
tool:
adb push build_android/example_system_wide ../system_wide_trace_cfg.pbtxt \
         /data/local/tmp/
adb shell "\
    cd /data/local/tmp; \
    rm -f /data/misc/perfetto-traces/example_system_wide.perfetto-trace; \
    cat system_wide_trace_cfg.pbtxt | \
        perfetto --config - --txt --background \
                 -o
                 /data/misc/perfetto-traces/example_system_wide.perfetto-trace; \
    ./example_system_wide"
Finally, retrieve the resulting trace:
adb pull /data/misc/perfetto-traces/example_system_wide.perfetto-trace
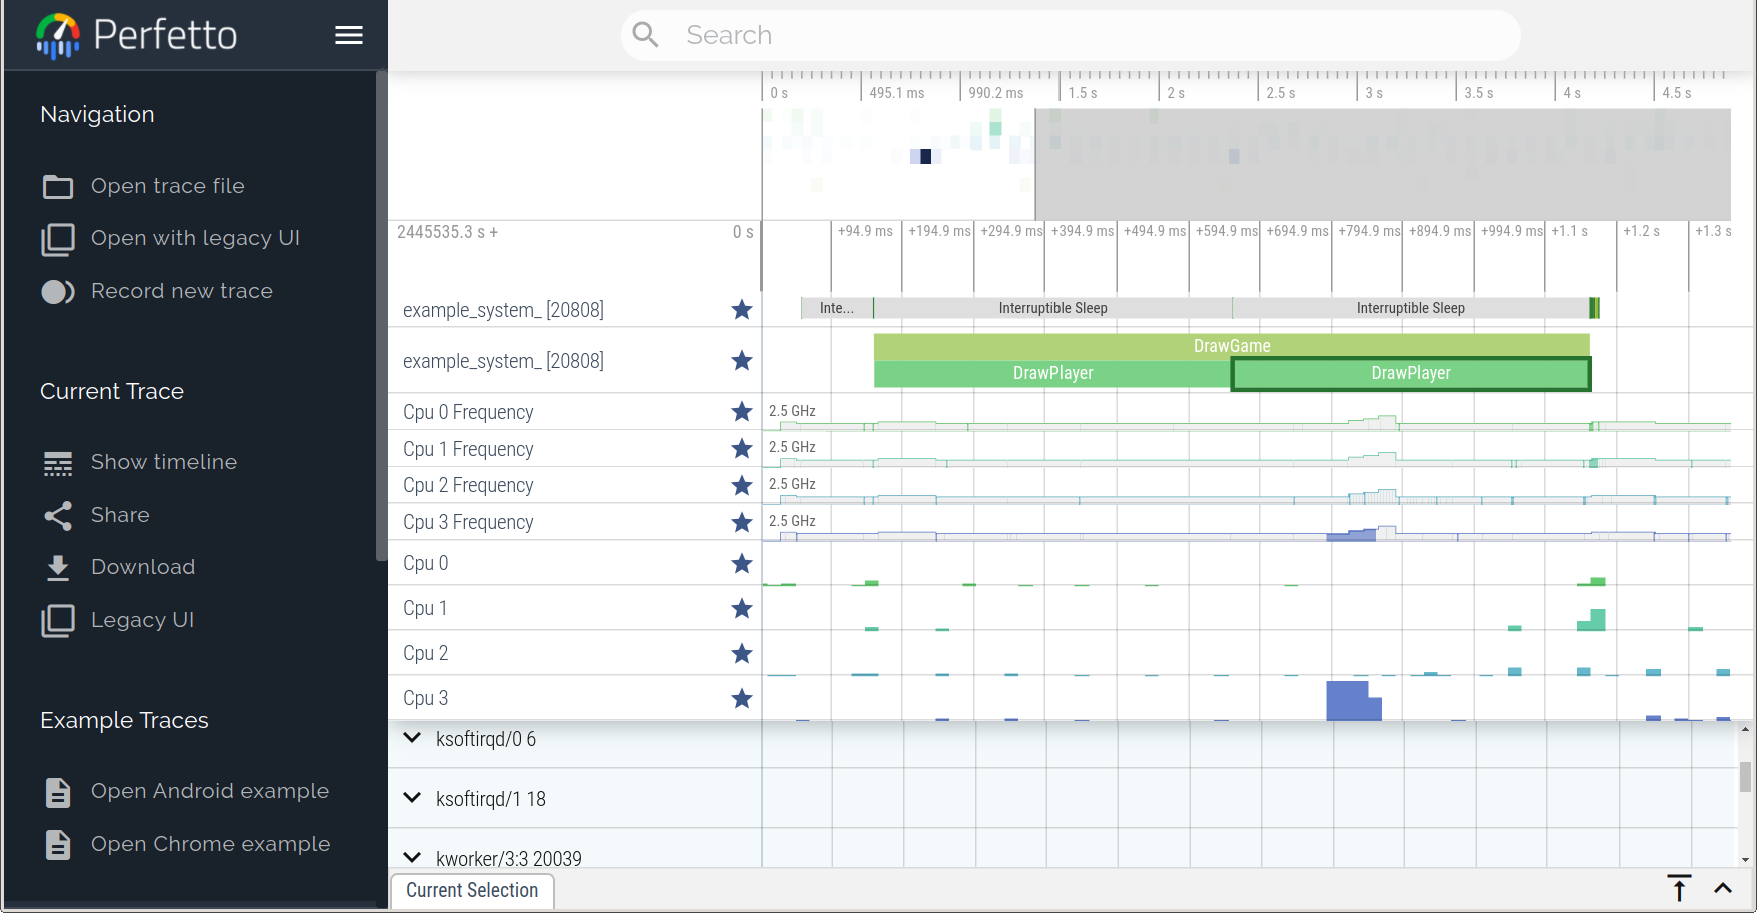
When opened in the Perfetto UI, the trace now shows additional contextual information such as CPU frequencies and kernel scheduler information.
Tip: You can generate a new trace config with additional data sources using the Perfetto UI and replace
system_wide_trace_cfg.pbtxtwith the generated config.
Custom data source example
The final example shows how to use an application defined data source to emit custom, strongly typed data into a trace. Run it with:
build/example_custom_data_source
The program generates a trace file in example_custom_data_source.perfetto-trace,
which we can examine using Perfetto's trace_to_text tool to show the trace
packet written by the custom data source:
trace_to_text text example_custom_data_source.perfetto-trace
...
packet {
  trusted_uid: 0
  timestamp: 42
  trusted_packet_sequence_id: 2
  previous_packet_dropped: true
  for_testing {
    str: "Hello world!"
  }
}
...

